
IAT for London
About project
The Infrastructure Accessibility Index - IAT© highlights areas with ample services and easy pedestrian access to different types of infrastructure. IAT© is based on the "15-minute city" idea, which says that all important facilities and services for urban dwellers should be easily accessible within a 15-minute timeframe.
We assess infrastructure accessibility by surveying the facilities reachable within 15 minutes on foot, by car and by public transport.
We assess infrastructure accessibility by surveying the facilities reachable within 15 minutes on foot, by car and by public transport.
To yield an open and data-driven approach to urban development NOVAYA created an Infrastructure Accessibility Tool© that helps evaluate the sufficiency and convenience of infrastructure for city residents. The main goal is to measure the provision of infrastructure and the ecological situation in different parts of the city in order to identify priority areas for increasing or decreasing specific forms of development.
IAT© helps residents, city officials and businesses participate in city planning. Integrating this tool with existing urban planning processes enables a transition from opaque decision-making to a more open process with quantifiable results. This facilitates transformation from fragmented development to balanced land-use and building densities with quality of living that meets the needs of local citizens.
IAT© helps residents, city officials and businesses participate in city planning. Integrating this tool with existing urban planning processes enables a transition from opaque decision-making to a more open process with quantifiable results. This facilitates transformation from fragmented development to balanced land-use and building densities with quality of living that meets the needs of local citizens.
15-minute city
'15-minute city' is an increasingly popular post-car era vision for strategic urban development and management. The idea focuses on mixing as many uses as possible within small local zones. The Covid-19 pandemic has led to a drastic reduction in journeys made and so has highlighted the usefulness of having all important facilities easily accessible within a short distance of people's homes. Examples of implementation of the'15-minute city' concept can be found in Melbourne, Ottawa, Detroit and most recently in Paris. Implementing '15 minute city' improves the daily life of city dwellers, as well as local ecology, and gives an opportunity to revitalise urban space.
We use the '15-minute city' approach in our IAT© methodology to evaluate the infrastructure accessibility within a 15-minute walk of any point in the city. We also evaluate the area within the same time-radius for other modes of transport to compare the results and find areas for improvement and solutions to problems.
We use the '15-minute city' approach in our IAT© methodology to evaluate the infrastructure accessibility within a 15-minute walk of any point in the city. We also evaluate the area within the same time-radius for other modes of transport to compare the results and find areas for improvement and solutions to problems.
Residents can use IAT© data to make informed decisions about their life choices. For example, information about the air quality and accessibility of different types of infrastructure and services in different areas could inform a house move to a new neighbourhood.
IAT© helps to unveil areas with insufficient provision of services or poor connectivity thus helping city officials to move towards optimal urban policy utilising minimal resources, and to propose strategic solutions for specific areas with unique challenges.
For developers, IAT© offers an opportunity to assess brownfield sites and select suitable areas for future development with the best infrastructure provision level. Because IAT© identifies the specific infrastructure that is needed at any site, developers can avoid unnecessary and wasteful excess construction.
Based on our method for Izhevsk IAT©, the Infrastructure Accessibility Tool© for London is developing the approach further by categorising the infrastructure into three types (necessary, social and optional) and adding public transport infrastructure evaluation and ecological monitoring. The concept of three types of infrastructure is inspired by the work of Jan Gehl (see Turku Urban Research Programme's Research Report "A Sense of Place"). Necessary infrastructure hosts routine activities (schools, shops, grocery stores, etc.), social infrastructure hosts interpersonal activities (e.g. bars, cafés, clubs, culture, leisure, etc.) and optional infrastructure generally hosts leisure activities (gyms, spas, hairdressers, business services, etc.).
Air pollution was assessed for three components: NO2, Pm 10, PM 2.5, NO. We chose these indicators due to the availability of official modelling data, their strong health effects and limits on the volume of pollution permitted in the UK. The chosen pollutants are ones which are known to affect health within London specifically, and can be predicted with this model. We have identified areas of the city where the average air pollution exceeds the permissible concentration.
What IAT numbers mean
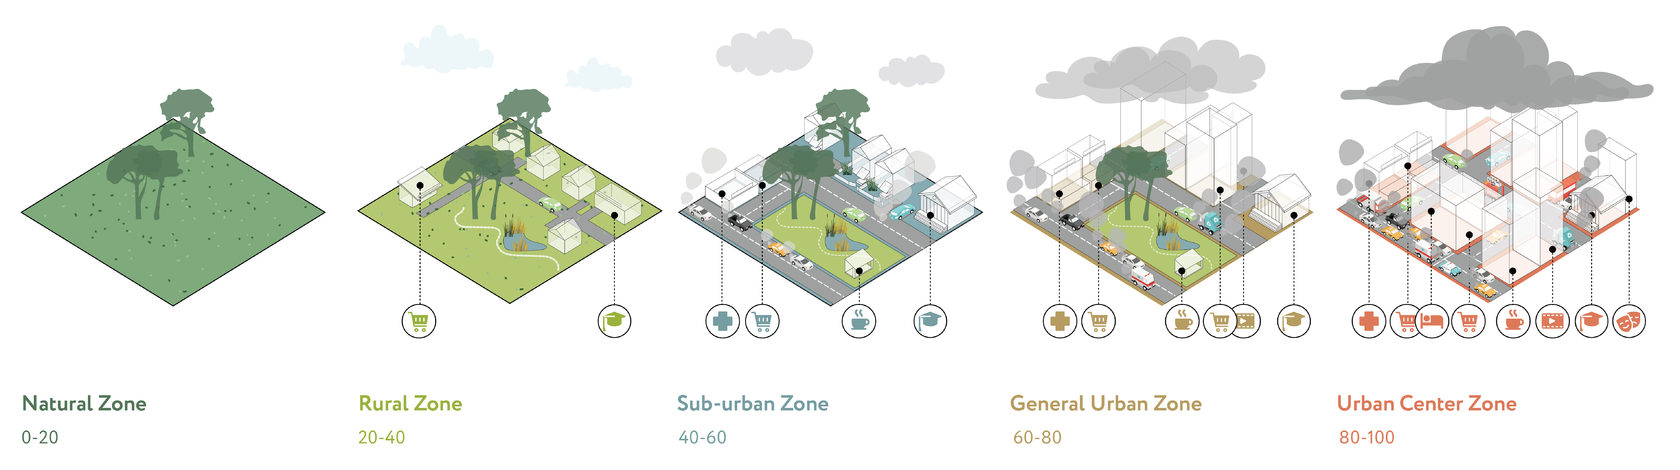
0-20: Natural area with a limited urban footprint, population count close to 0, air quality and overall ecological situation - good.
20-40: Rural green area, at the urban outskirts with detached and semi-detached housing. Infrastructure in 15-minute accessibility is limited to grocery stores, daycare and primary schools. Good ecological situation.
40-60: Suburban area with semi-detached housing, good transport network, a wider choice of service infrastructure within 15-minute access. Air quality and ecological situation is worsened by vehicle exhaust.
60-80: General Urban Area with mid- and high-rise multifunctional buildings, developed road network and public transportation, cultural and medical facilities, universities, open spaces etc. within 15-minute accessibility. Ecological situation is affected by vehicles and industry.
80-100: Central Urban area with dense high-rises, widest choice of services within 15-minute access. Limited access to open space, tight ecologic situation due to vehicle and industrial exhaust and urban heat island.
IAT© is instrumental in:
IAT© can be tailored for:
- Balancing urban mix and promoting spatial equality by identifying current and future shortages of infrastructure provision;
- Making the land and real estate market more transparent by publishing data on infrastructure accessibility;
- Taking control over urban sprawl with planning permissions granted in areas with pre-existing favourable conditions and high infrastructure accessibility;
- Developing and monitoring strategic planning documents.
IAT© can be tailored for:
- General public;
- Property developers and retail business;
- Planning, Transport, Land Registry and other National, Regional and Municipal Departments using GIS.
- Shops: we gathered POI data on convenience stores, food and drink shops, pharmacies, petrol stations, EV charging stations and ATMs from HERE Places API
- Schools data is from the London Schools Atlas
- Childcare data is from FOI: early years dataset
- Restaurants: we gathered POI data on restaurants, cafes and fast-food places from HERE Places API
- Culture, leisure and amenities data is taken from both HERE Places API and the London Cultural Infrastructure map
- Parks data is from Designated Open Space
- Shops and services: we gathered POI data on shopping malls, bookshops, department stores, car rentals and dealers, business services and governmet facilities from HERE Places API
- Sport facilities data is from HERE Places API
- Healthcare data is a combination of POI data (dentists, general practitioners, optitians) from HERE Places API and NHS hospitals location data
- Universities data is from the Office for Students The OfS Register
- Public transport condition is evaluated with HERE Public Transit API displaying how many public transport stops can be reached from a certain point in 15 minutes
- Air quality modeling data is taken from the London Atmospheric Emissions Inventory (2016), and limits of pollution level were given in the air quality in Europe report (2019).
Let's talk
Tell us how we can help you