
Contribution of different types of infrastructure
Knowing the total index value for every cell, we can estimate a median index for a borough in order to see a more general picture. The boroughs on the graph are listed in order of their distance from the centre so we see the general tendency: the further from the centre, the lesser the index value. Of course, that tendency cannot be applied directly, e.g. the City of Westminster is further from the centre than Southwark, but actually part of that borough belongs to the CAZ so its infrastructure provision level is significantly higher.
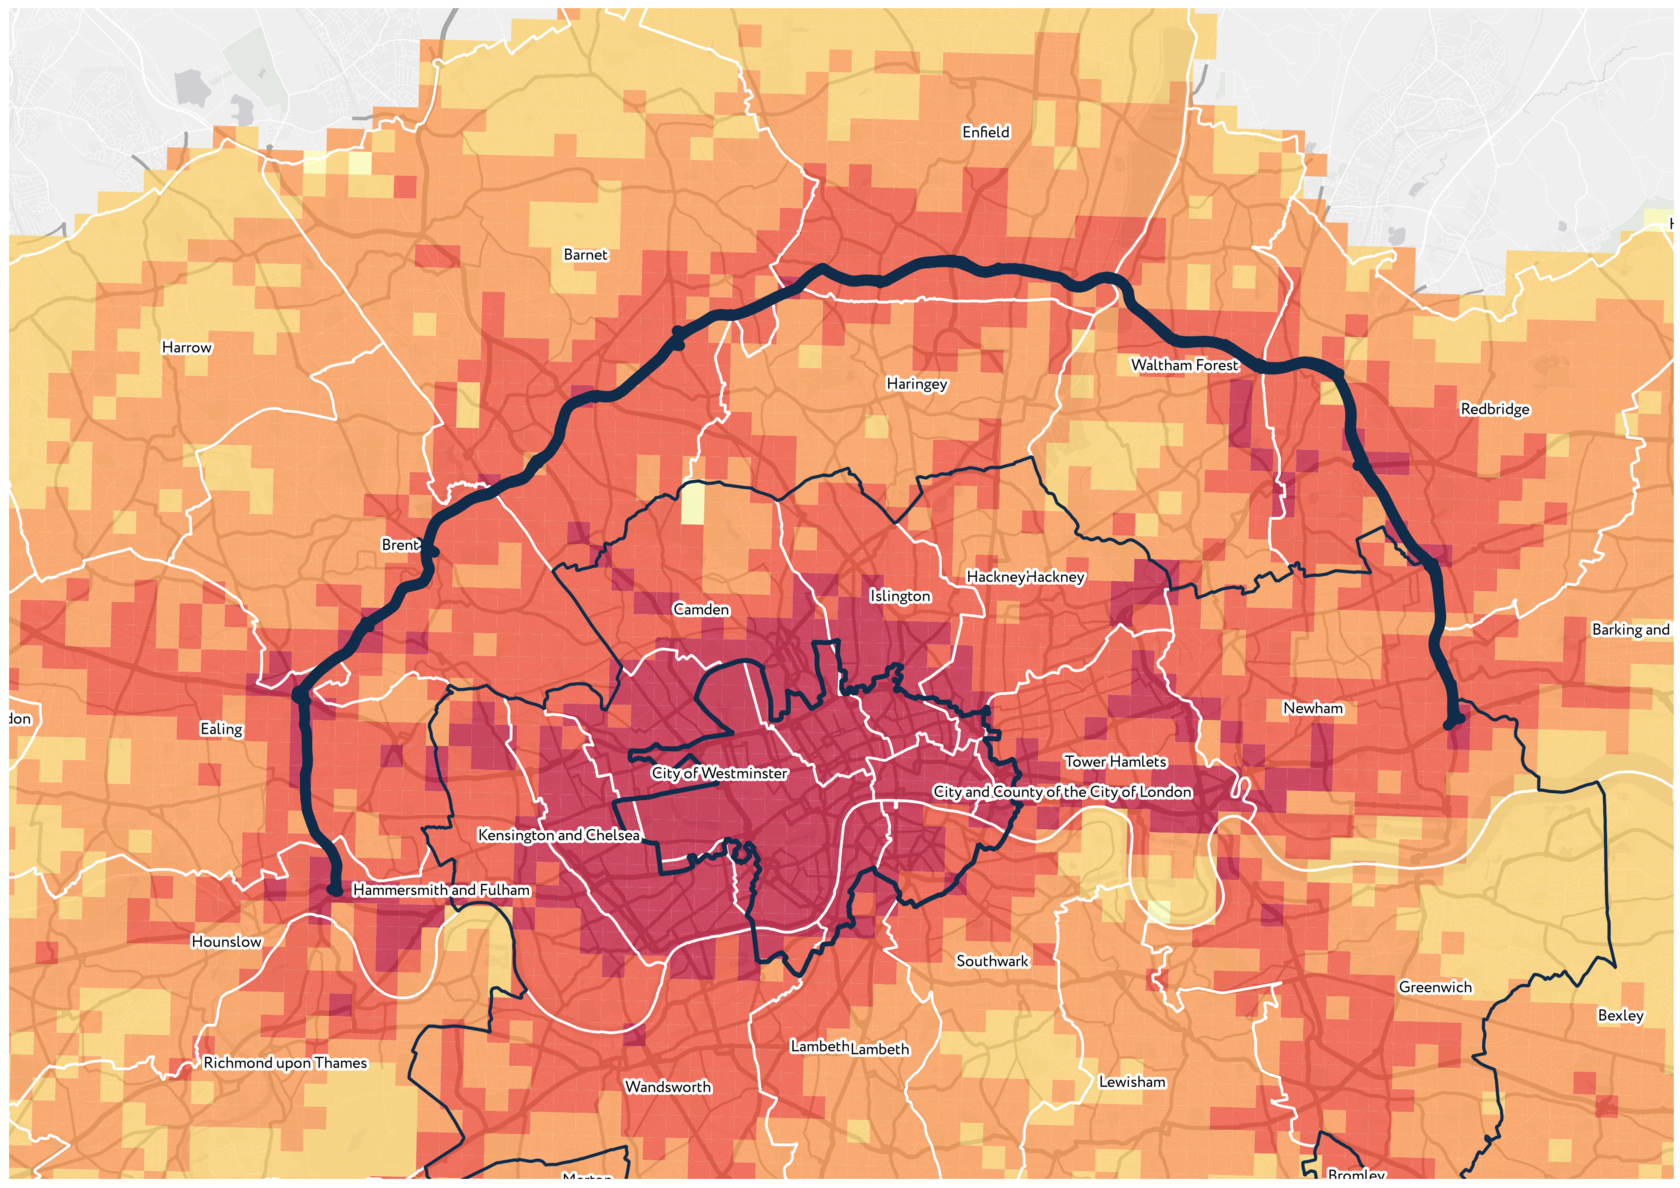
We also can see the difference between the value for two mobility types: 15-minute walk and 15-minute car ride, the car ride being the way with better access to infrastructure. The most significant differences between those values are in northern peripheral boroughs in Outer London, along the North Circular road. We can infer that people living in these boroughs have less access to public transport and have to rely heavily on the car in their daily movements.
The high index value on the areas near the North Circular can be explained by the fact that the average isochrone area of these territories is thirty per cent larger than in the whole of London.
The high index value on the areas near the North Circular can be explained by the fact that the average isochrone area of these territories is thirty per cent larger than in the whole of London.
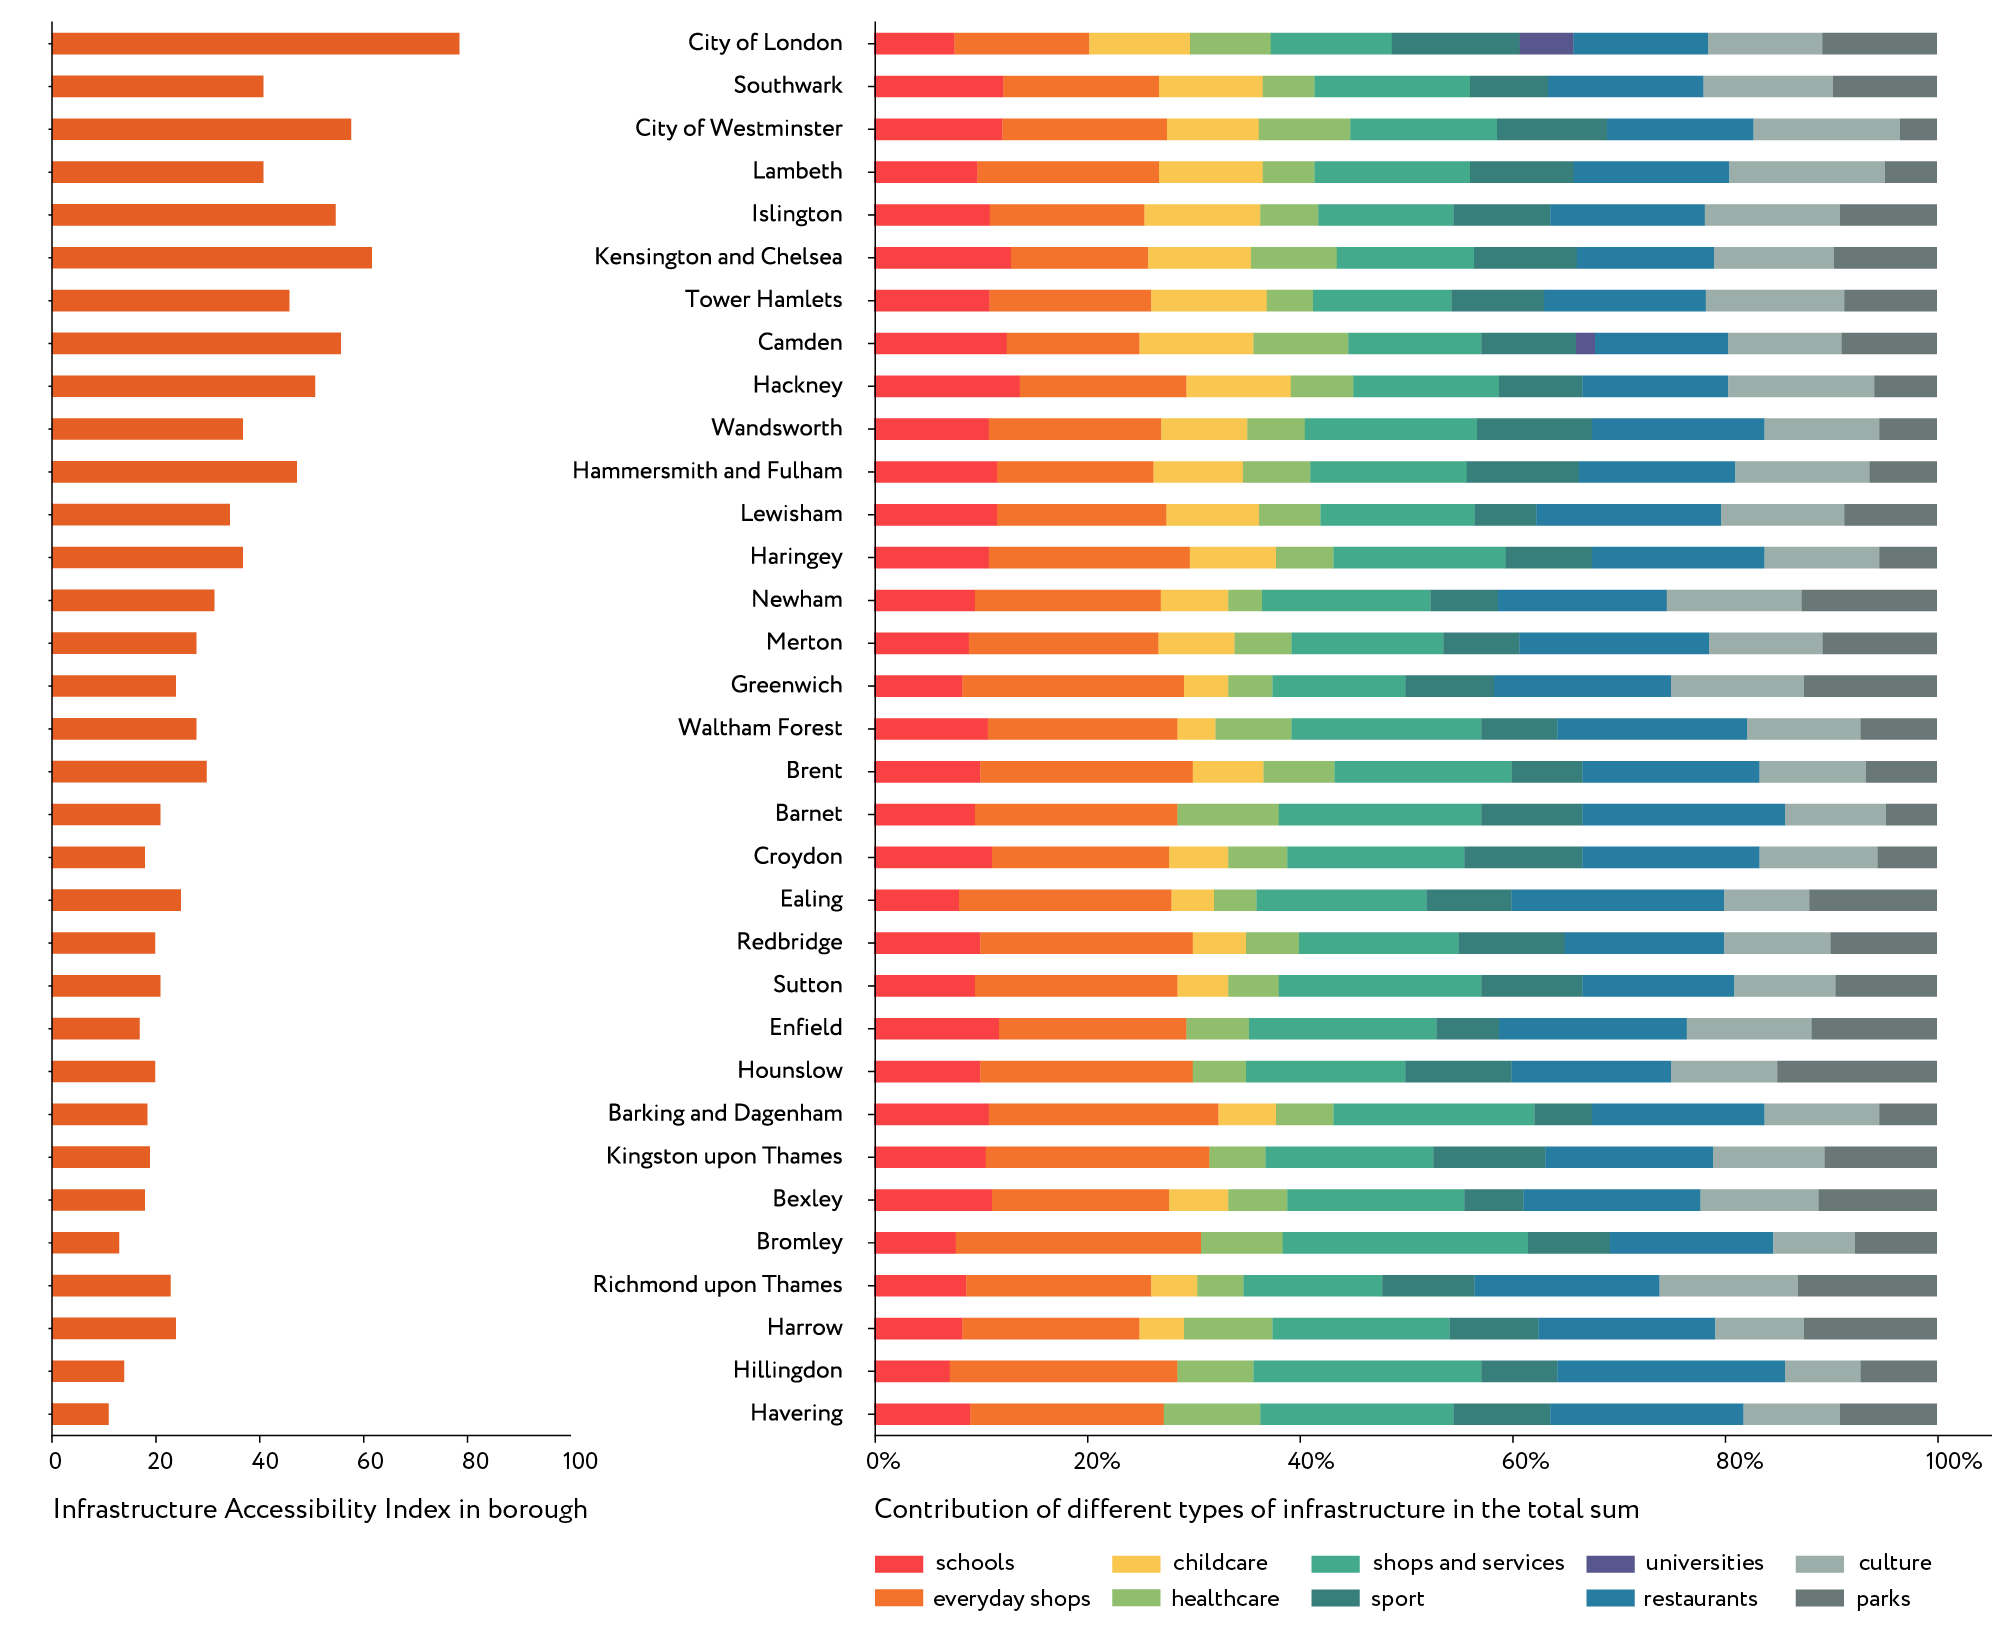
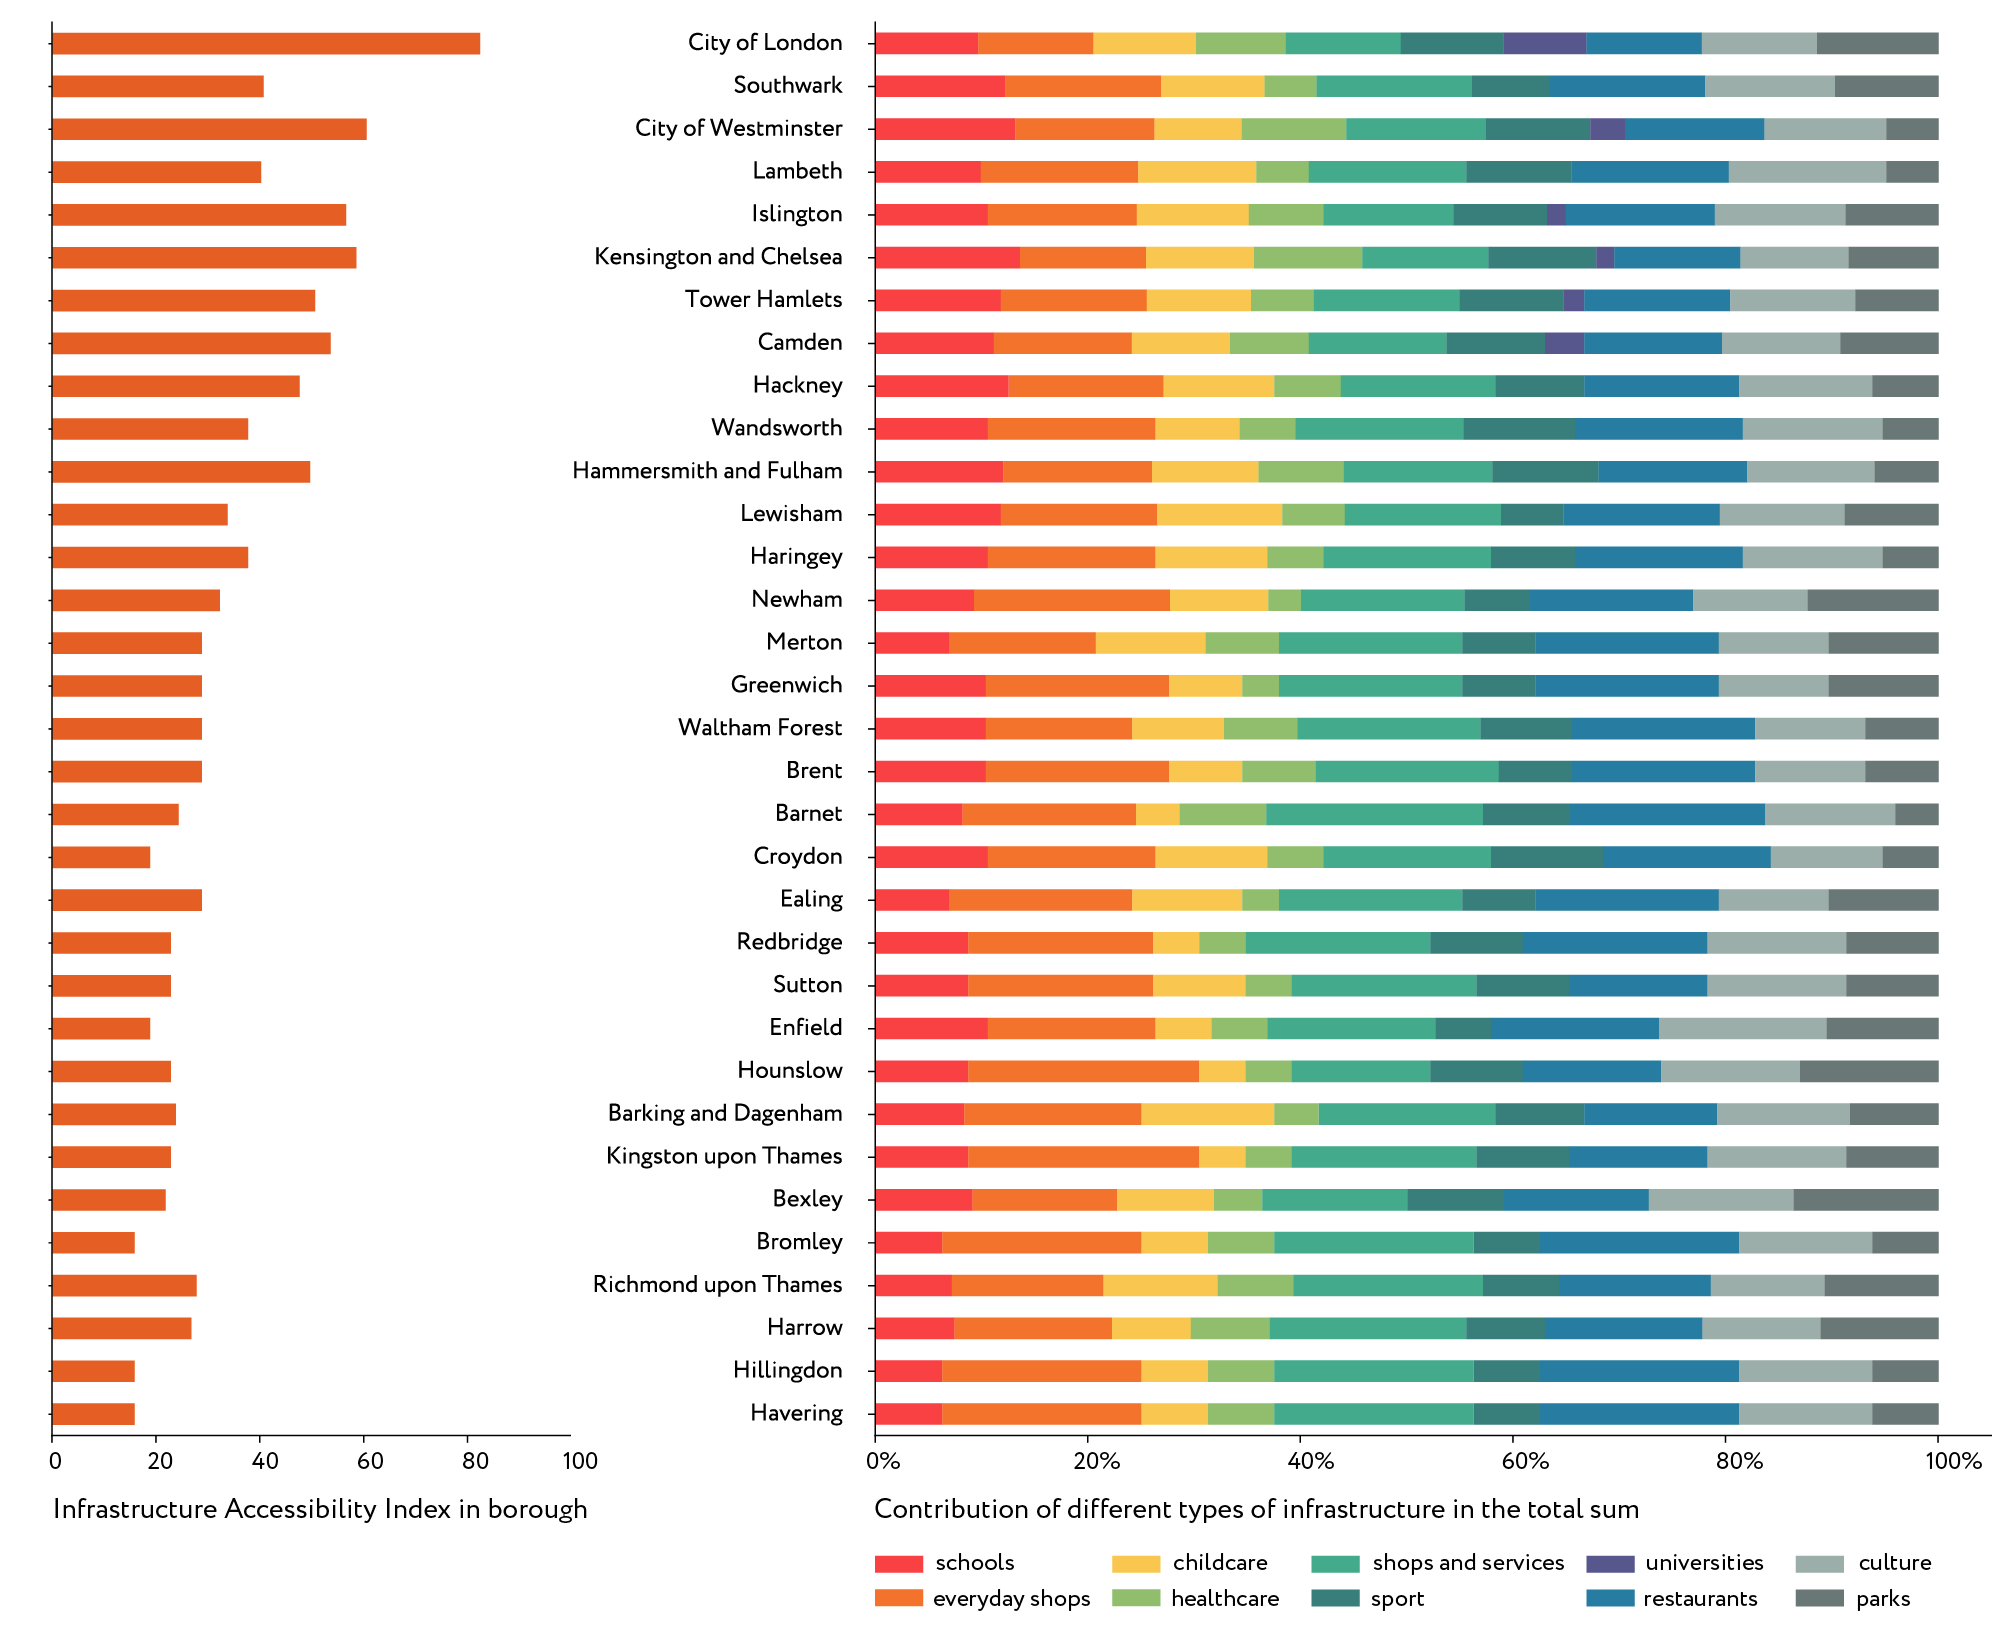
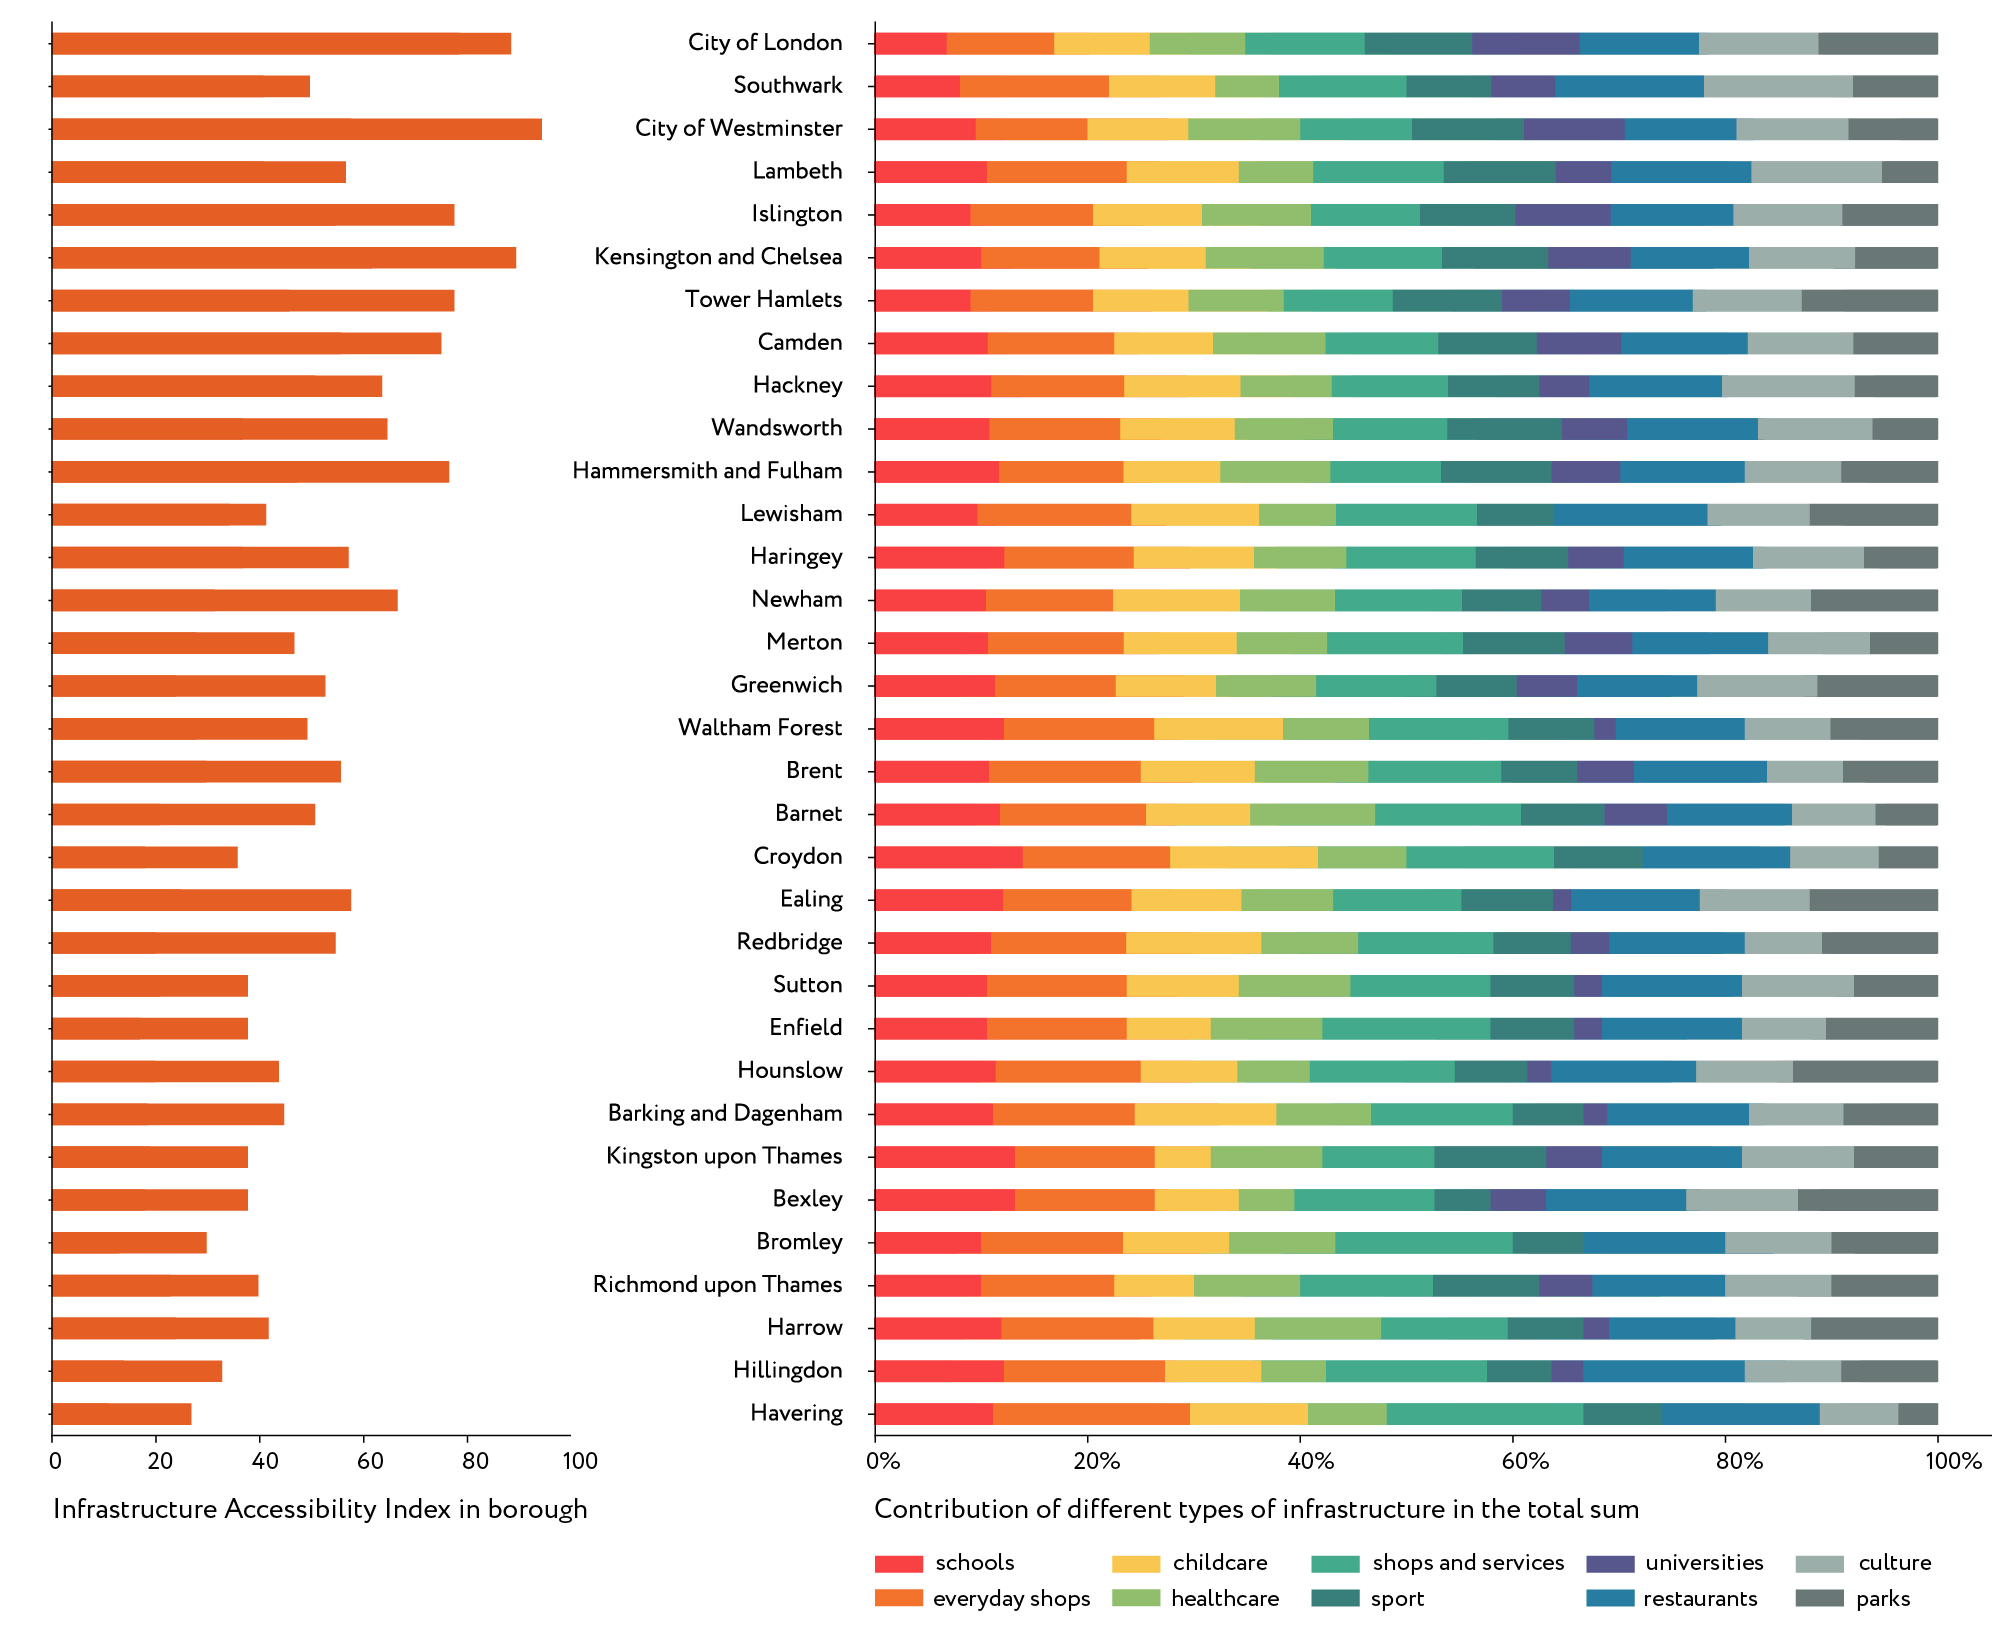
The main contribution in the total index when assessing walking accessibility is made by schools, everyday shops and services, optional shops and services and restaurants. We can see that these are the types of services that can be reached on foot from nearly anywhere in London. The picture is more evenly distributed when assessing the accessibility by car, and we can see that the role of everyday services is less significant in the total sum. Health services, childcare facilities and universities have a considerably higher level of accessibility by car, while the accessibility of culture, sports facilities and parks stays more or less the same within two types of assessment.
Explore the map
IAT© can be integrated into existing urban planning systems in order to assess urban policy implementation and formulate place specific development programs. Explore the map with IAT© index layers corresponding to London Plan town centres, opportunity areas, brownfields and more.
Let's talk
Tell us how we can help you